TeamScore Dashboard Overview
The TeamScore Dashboard is a key interface for managers and executives to get a snapshot of what their team members have done on any given past date. It aggregates and visualizes user activities, scores, and availability in a straightforward, timezone-aware format.
Selecting Dates and Views
At the top left of the dashboard, you can change the date by clicking the calendar icon and selecting any past date. Future dates are intentionally disabled because TeamScore only shows what has already happened, not future plans.
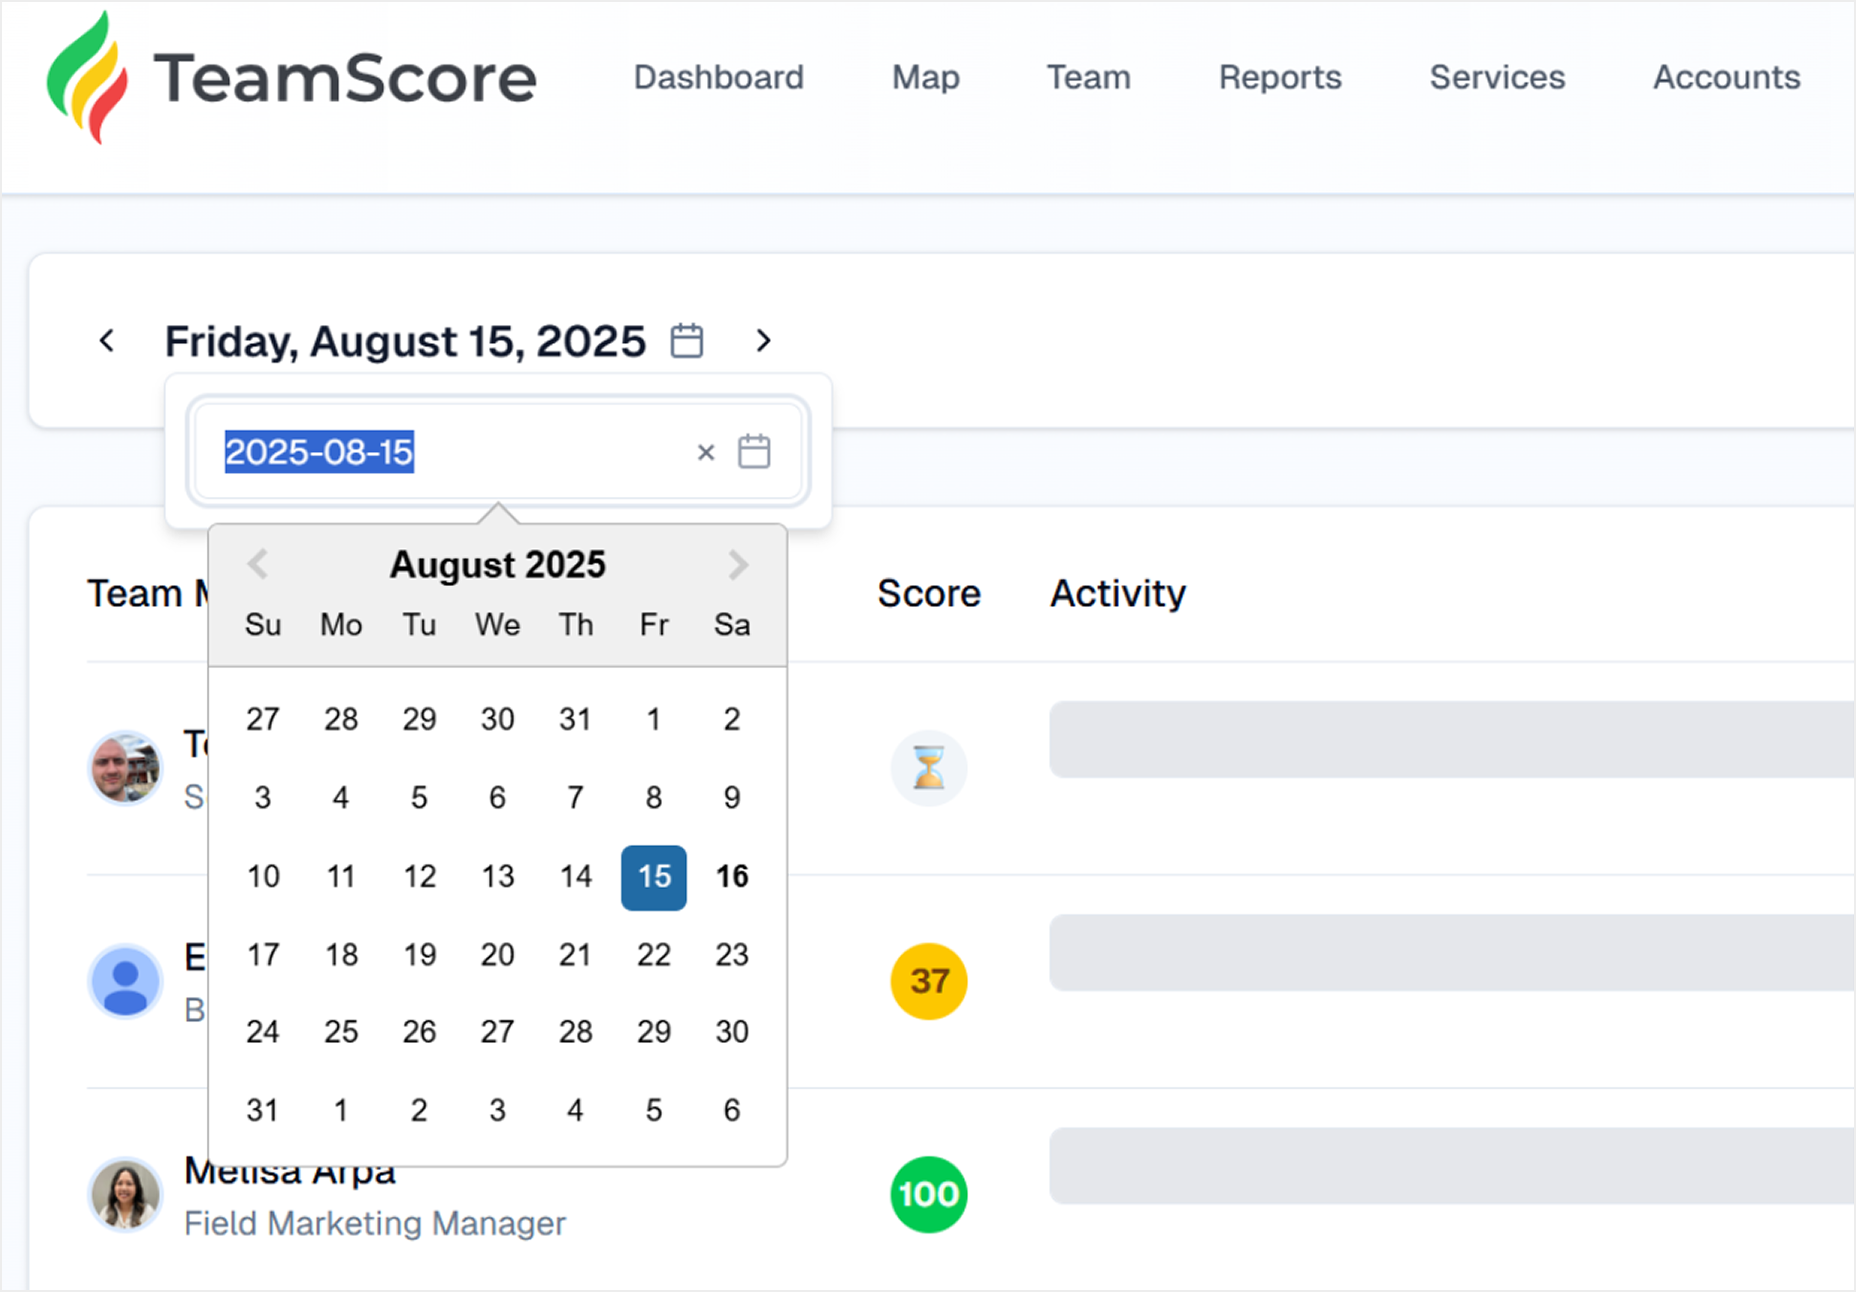
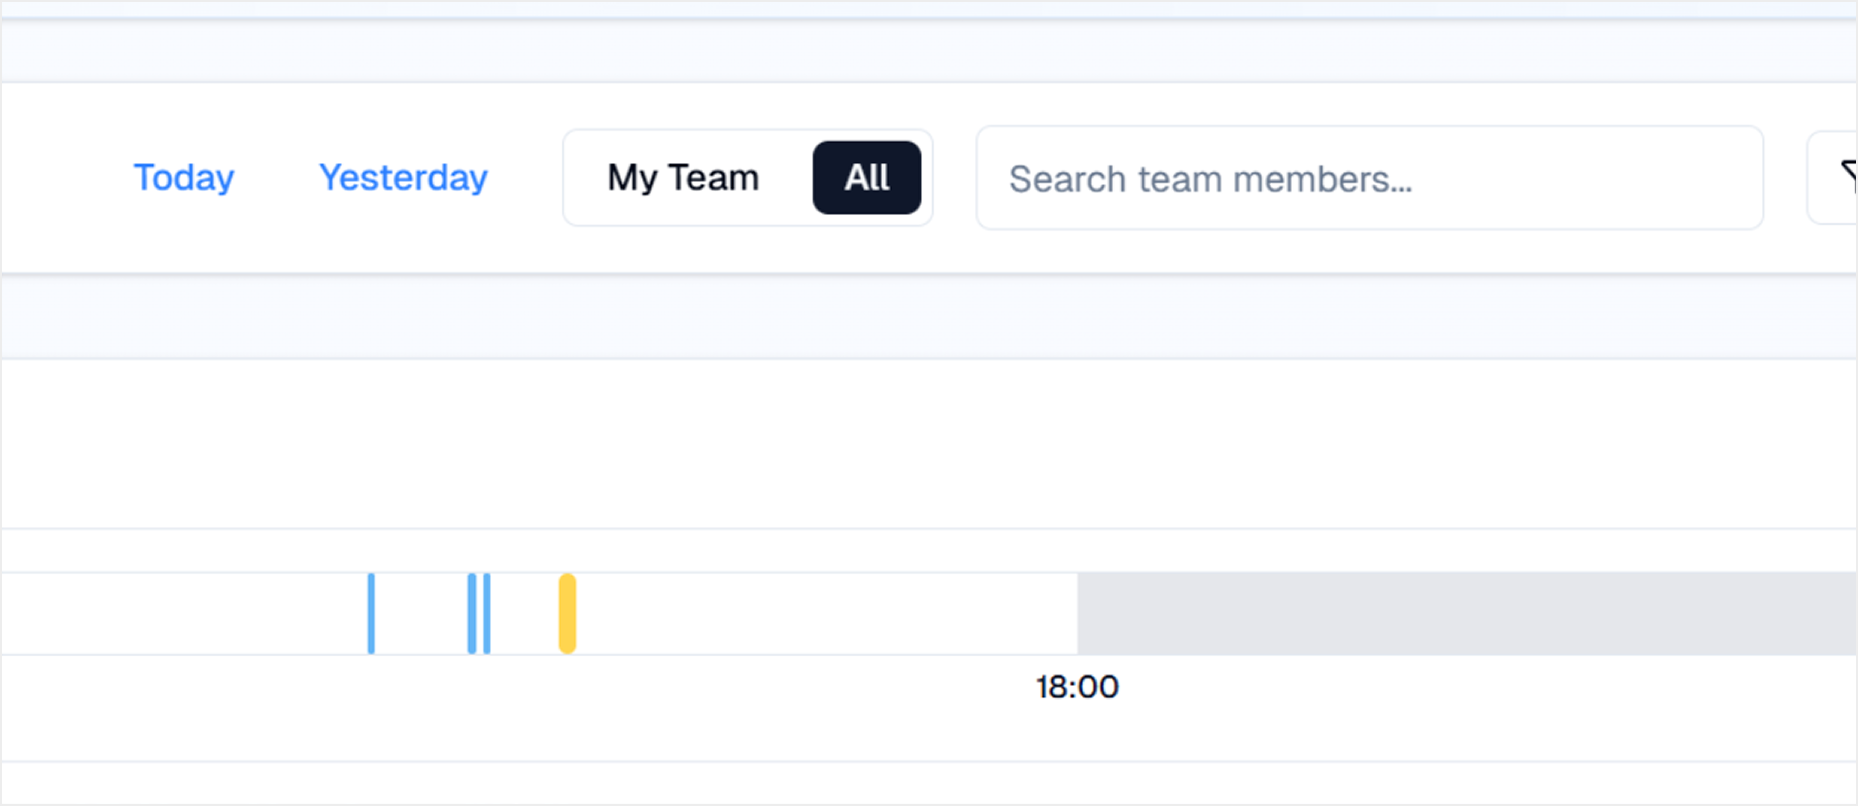
You also have quick shortcuts to select Today or Yesterday. Additionally, you can toggle between My Team (people who directly report to you) and All Users available in your account. For larger groups, search functionality enables partial matching by first name, last name, or email address.
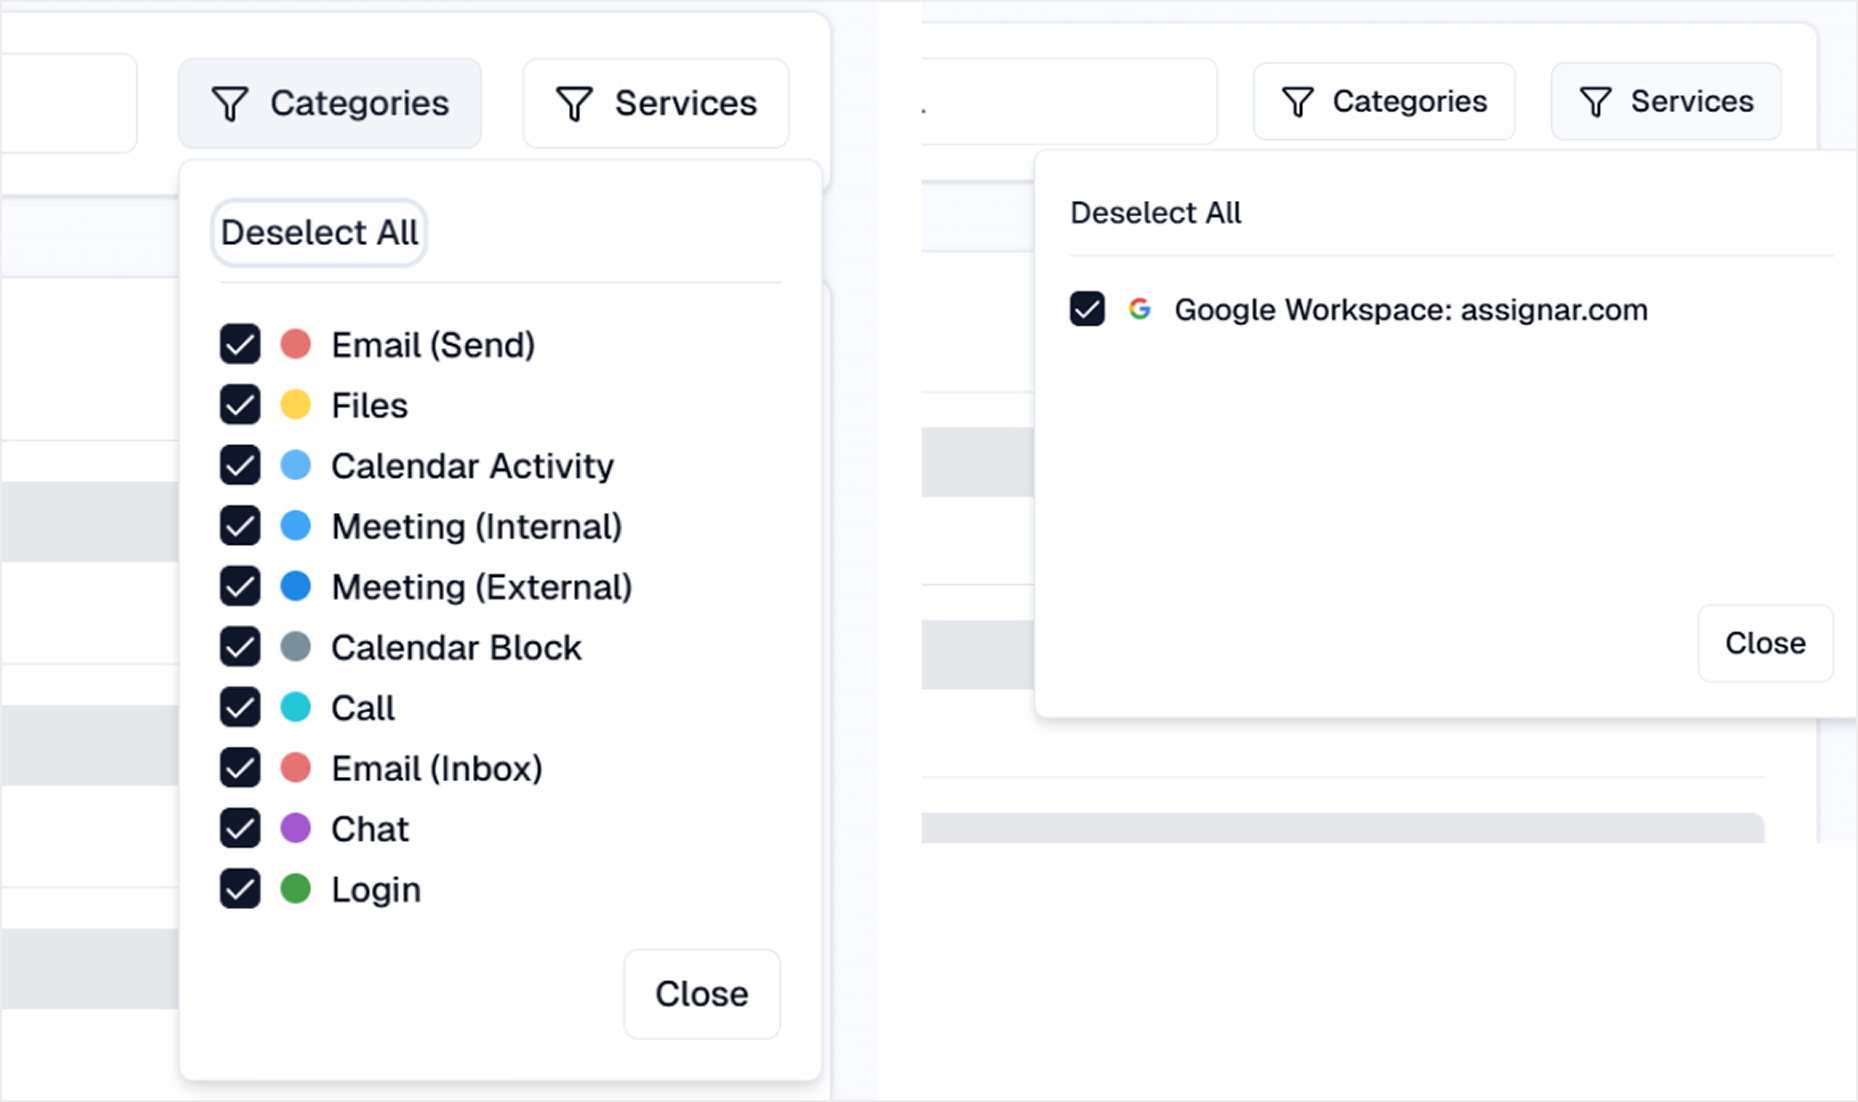
Filtering Data
To further customize your view, use the filters available:
- Activity Categories: Choose specific types of activities to display by checking or unchecking categories. By default, all categories are selected and no count indicator appears.
- Services: If your account aggregates data from multiple services, you can filter which ones to include in the dashboard view.
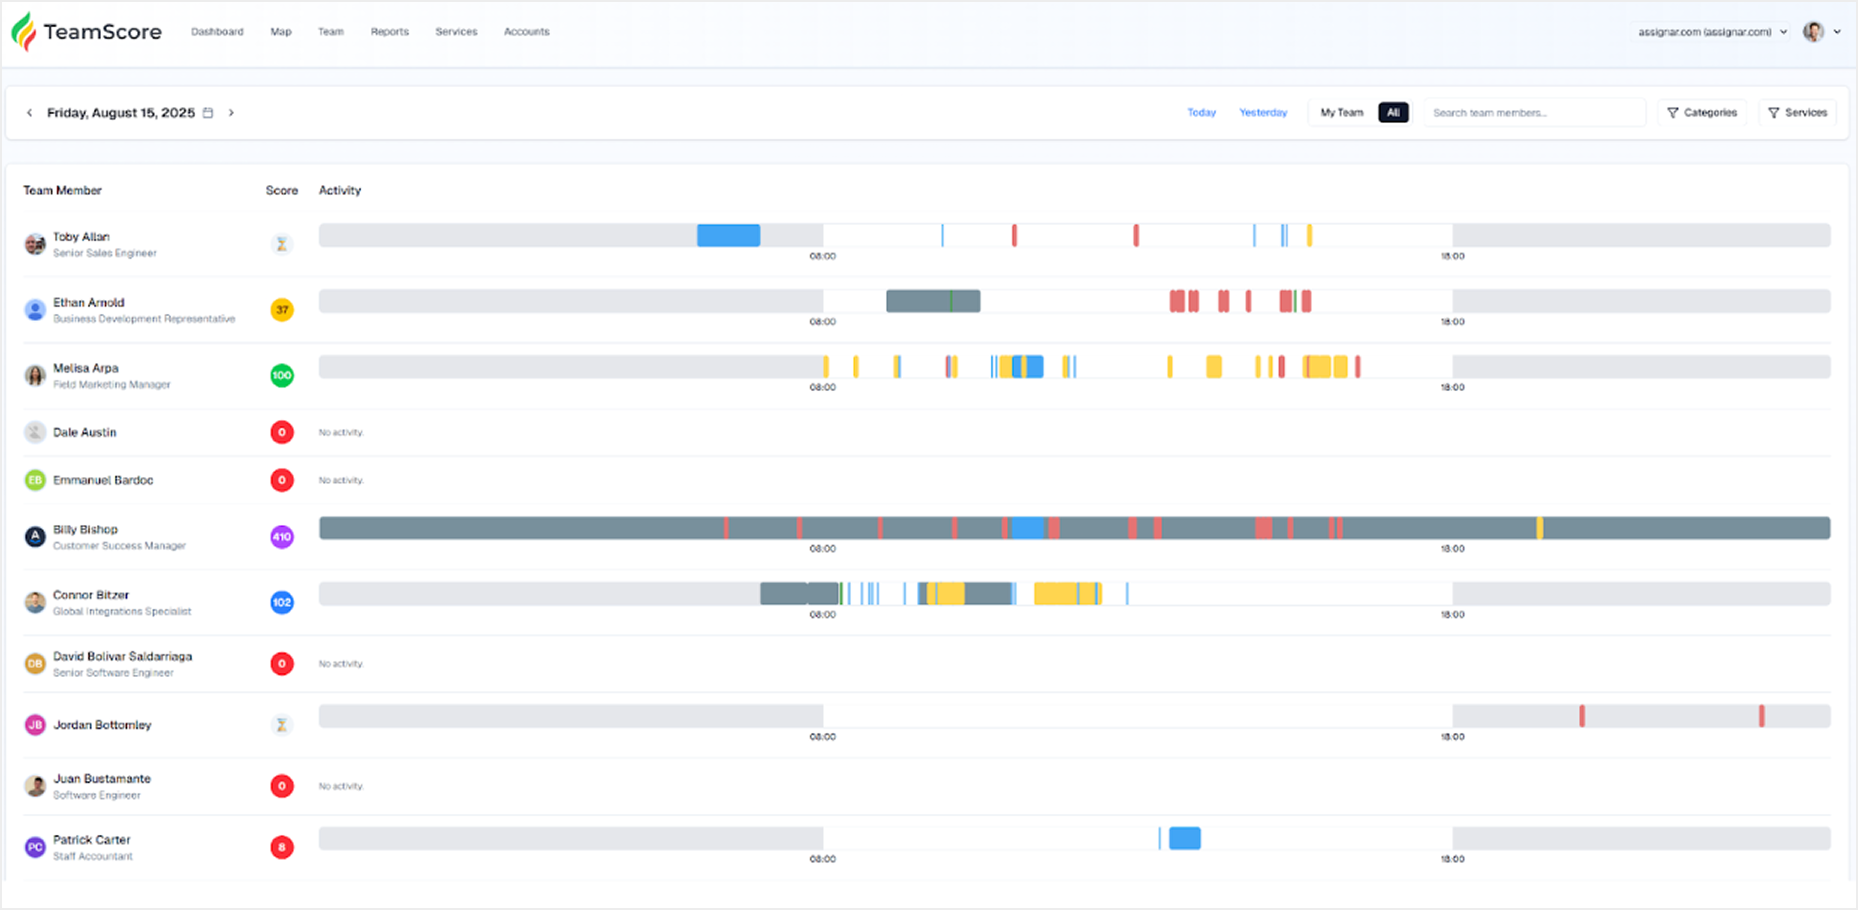
Understanding the Dashboard Layout
The main part of the dashboard shows a list of individuals matching your filters. For each person, the following information is displayed:
- Name: Clickable to open a detailed activity view for that user on the selected day.
- Score: A daily activity score calculated based on the user's local timezone, updated around 1–2 AM local time. Instead of a number, an hourglass icon means the score has not yet been computed.
- Status Icons: A palm tree icon indicates the person was on vacation or a scheduled non-work day (e.g., holidays or adjusted schedules) to keep scores fair.
- Activity Bar: A visual representation of the user's activities throughout the day, color-coded by activity category.
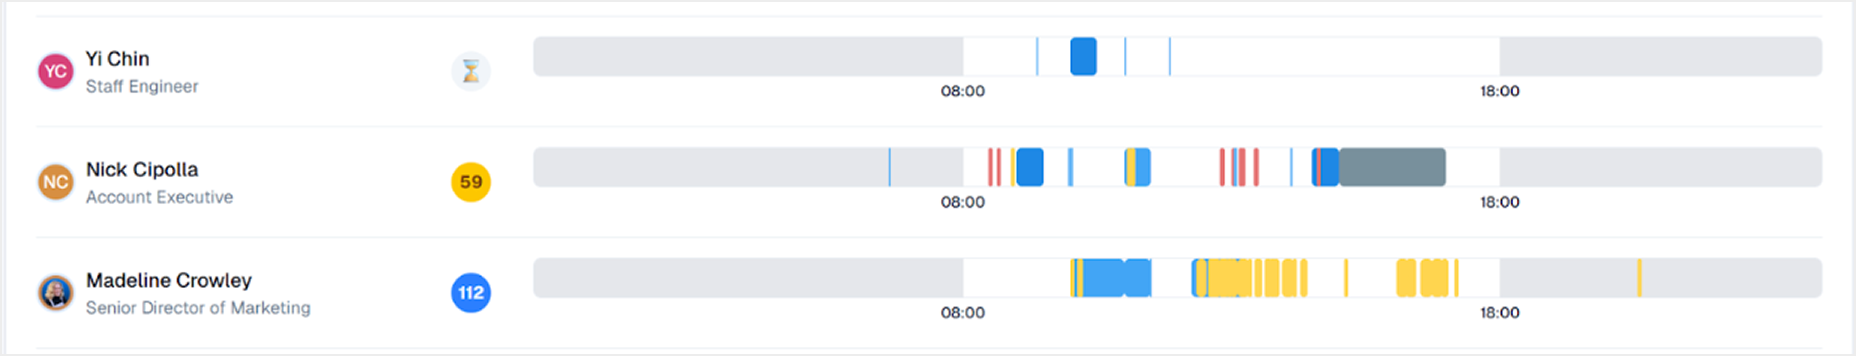
Activity Bar Details
The activity bar shows work time in color-coded segments and non-work hours in gray on either side. By default, non-work hours are before 8 AM and after 6 PM local time, but these hours can be customized if your account supports schedule adjustments.
Because the dashboard is timezone aware, all times reflect the user’s local timezone, allowing you to meaningfully compare team members in different parts of the world.
Colors correspond to activity categories, and you can hover over segments for more detail on the specific activity performed.
Additional Notes
- The system shows all users regardless of whether they were active on the selected date — for example, new employees added recently will appear with no activity on past dates.
- Scores and activities are intended as retrospective overviews and do not predict future work.
For a deeper dive into individual user activities on a given day, see the Activity Screen help guide.